
The Price Isn’t Right
Fundamentals Don’t Support $100 Oil


As physical markets flash extreme tightness, many analysts now warn that oil futures curves no longer reflect physical reality. They argue that $100 oil dramatically understates true scarcity, masking structural shortages, geopolitical fragility, and nearly a billion barrels of lost supply behind a futures structure shaped more by financial positioning than physical fundamentals.
They misunderstand what futures markets are designed to price.
Physical and futures prices can both be correct if you understand what each measures. Depending on location and crude quality, physical spot barrels are effectively trading closer to $150. That is the price for oil today. The price on trading screens is something different: roughly $104 for Brent futures or options tied to delivery in late July. One is cash for an immediate physical barrel. The other is a financial contract pricing expectations roughly nine weeks into the future.
The simplest way to understand the difference is that futures markets always discount the future. A barrel delivered several months from now contains far more uncertainty than a barrel available today. Nine weeks ago, for example, Brent traded near $71—more than $30 below today’s prompt physical price. Futures markets are not pricing what oil is worth now. They are pricing what traders think conditions might look like weeks or months ahead.
Markets do not pull oil prices out of thin air. One of the most important inputs is inventory. Figure 1 shows the relationship between OECD comparative inventory and Brent price. Comparative inventory is simply current storage minus the 5-year average for the same time of year. That relationship is almost always inverse to price, and the logic is straightforward.
Comparative inventory is essentially the market’s oil savings account. When inventories are comfortably above normal, the risk of shortage is low and prices tend to fall. When inventories shrink below normal, markets become anxious about supply security and prices rise.

The EIA currently projects the comparative inventory deficit to deepen into August before gradually moving back toward the 5-year average. Its associated Brent forecast for August is about $88 per barrel. I am not arguing that the forecast is correct, only that it represents a hard data-based anchor for how markets are evaluating future supply risk.
Figure 2 shows the same data as a cross-plot. The three trend lines resemble bond yield curves except that oil price replaces interest rate and comparative inventory replaces maturity as the relevant measure of risk. In bonds, risk rises with time. In oil, risk rises as inventories fall below normal.
The red circle represents the first-quarter 2026 price-versus-value data point. By dropping a vertical line to the orange yield curve and reading across to the y-axis, we derive an implied marginal price of roughly $70 per barrel.
In other words, futures markets are not ignoring the risks associated with the Iran War. They have already embedded about a $30 geopolitical premium into current pricing. Inventories imply a price closer to $70, while markets are pricing oil near $99. That is a substantial overvaluation relative to inventory fundamentals.
This is how markets translate uncertainty into price. Oil cannot trade at theoretical values unless counterparties are willing underwrite that transaction.

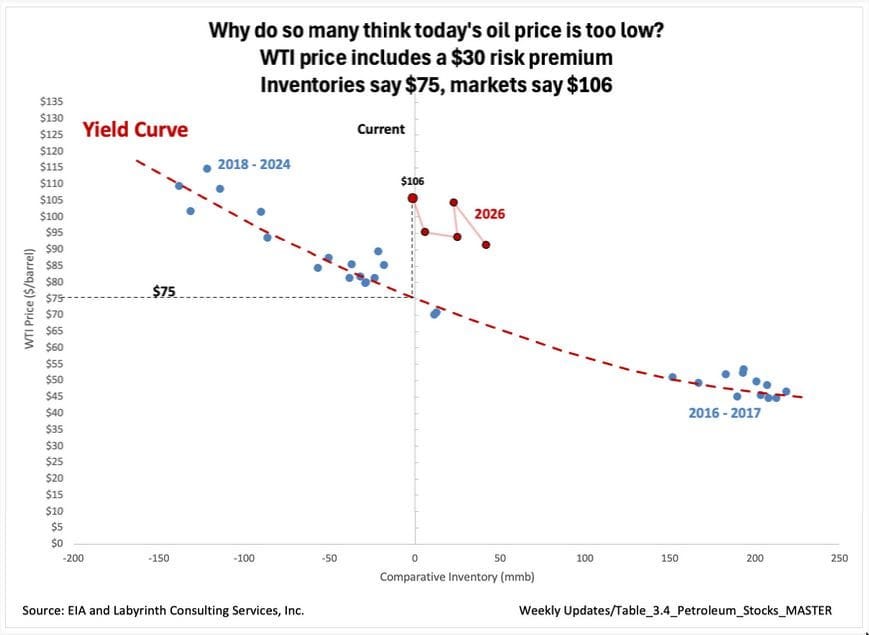
That process includes price discovery. WTI storage data is released weekly whereas OECD inventory data is only published monthly, allowing for more detailed tracking of the relationship between price and supply. Figure 3 shows WTI comparative inventory, its current yield curve, and the price-volume data points that define and constrain it.
The most important thing about these yield curves is that they are not precise mathematical regressions. They are trend lines punctuated by episodes of price discovery. Deviations from the curve are therefore just as important as the data points that fall on it.
Those excursions occur when traders believe something structural in the market may have changed. Prices are bid up or down until the market reaches the price limit at which counterparties are willing to buy or sell. At that point, price-volume relationships either revert toward the existing yield curve or establish a new one if the discovery process reveals a fundamentally different level of supply urgency.
The Iran War and the 2026 price-volume data points are a textbook example of such a price excursion. WTI at $106 was not an arbitrary number. It represented the highest price traders were willing to pay for a futures contract during the week ending May 1, 2026. One may believe that current physical scarcity justifies $150 oil, but markets do not move to theoretical scarcity values automatically. Price only rises to levels at which counterparties are willing to make a trade. Like it or not, that is how the process works.
Another important way to evaluate oil markets is through spreads—the difference between the first-month and some future month contract price. The wider the spread, the greater the implied supply urgency. A steep backwardation—the front month price is higher than the later-dated contract—signals that buyers are willing to pay a substantial premium for oil today relative to oil in the future.